By Tzach Livyatan
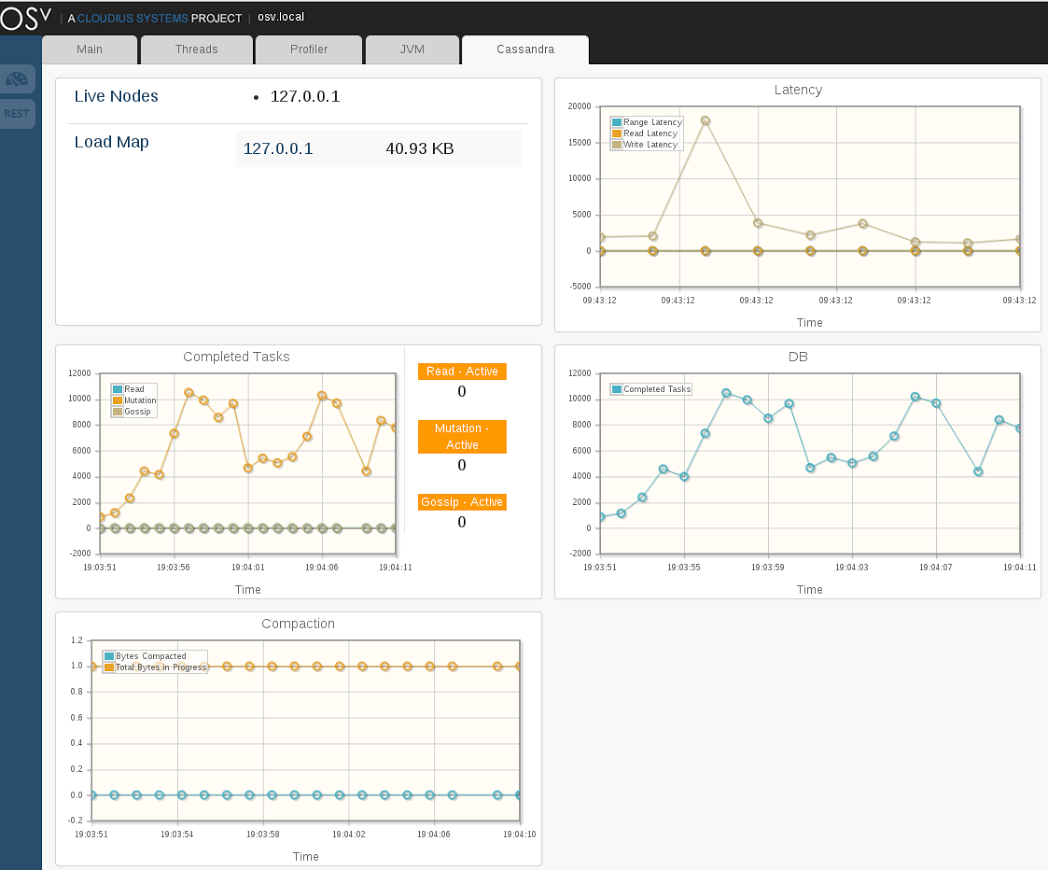
We are constantly looking for ways to improve the OSv virtual appliance experience. The latest improvement is an integrated dashboard, presenting a combination of:
- OS related metrics (CPU, memory, threads, …)
- Profiling related metrics (trace points)
- JVM related metrics (heap, GC, …)
- Cassandra related metrics (latency, tasks, cluster status)

The dashboard is yet another example of using
REST API to monitor and
control OSv and
OSv virtual appliances. These REST APIs are open for the
user directly. In particular, the new Capstan tab takes advantage of the newly added
Jolokia
connector, exposing JMX information over REST.
The OSv REST API makes it simple to manage your OSv virtual appliance with curl(1) or your own script.
There are other great tools out there for JVM monitoring and profiling, like VisualVM. The OSv dashboard is unique by unifying the end-to-end virtual appliances functionality: From the application to the JVM, down to the OS and HW status.
In particular, trace points allow a deep dive into the system execution, providing similar functionality on OSv to what DTrace does for Solaris.
We are planing to provide similar application-level tabs for other OSv virtual appliances. Want to build a tab for your favorite application on OSv? Clone the osv-gui repository and start submitting pull requests!
You can keep up with the latest OSv news from this blog’s feed, or following @CloudiusSystems on Twitter.

