
By Tzach Livyatan
We are pleased to announce the OSv 0.14 Alpha Release.
This is the first release to include the dashboard, a browser-based UI for OSv and virtual appliance status.
The dashboard includes (among other features):
-
Main tab with Memory, CPU, Disk
-
Thread tab with interactive visualization of thread status and thread usage. You can select and search for particular thread by name.
-
Trace tab, including frequency for each tracepoint. Selection by name and search are available.
-
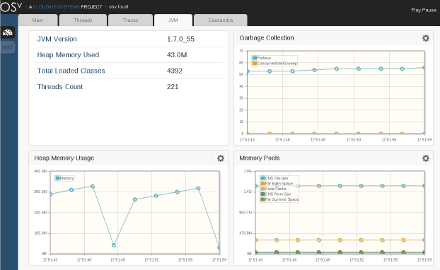
JVM tab for basic JVM information including memory and GC, when a JVM is installed.
-
Virtual Appliance tab for information relevant to the particular appliance. Tabs for Cassandra and Tomcat are currently available, with more to come.
To build the dashboard, just includes httpserver in the module list. For example:
$ make -j 4 image=cassandra,httpserver
Once the appliance is running, the dashboard is available on port 8000 by default. (You can change the port using cloud-init.)
The full 0.14 release announcement is available on the osv-dev mailing list. You can keep up with the latest OSv news from this blog’s feed, or folllowing @CloudiusSystems on Twitter.